
In a previous article, “Is it Time to Quit the ‘War on Cancer’?” we introduced the background for that so-called war, reviewed the policy changes that resulted from the 1971 legislation,[1] and analyzed why it may be time to put the war metaphor aside. We also saw that the fundamental question—are we winning the war?—is fraught.
Cancer was the second leading cause of death in 1970,[1] and remains so half a century later,[2] but that doesn’t mean there haven’t been advances. Many cancer researchers would point out that professional understanding of the disease has improved and suggest many reasons to be optimistic about personalized medicine, precision therapy, immunotherapy, or other cancer treatments getting a lot of attention today. Whether these are effective treatments or merely new buzzwords is perhaps up for debate, but there’s no denying that they have generated a lot of excitement, funding, and media attention.
On the other hand, not all cancer professionals are gung-ho about the war. Opinions vary widely. As described in the previous article, a gathering of professionals at the World Oncology Forum in Switzerland generally agreed that we are not winning the war.[3] But even within that crowd, there are differing views on what constitutes failure.
What about the data? Can it provide an objective answer to this question?

Cancer Incidence Versus Mortality—Overall Trends
Incidence refers to the number of new cases, often reported per 100,000 per year, whereas mortality refers to the number of deaths in a group of people over a specific timeframe.
For all cancer sites combined, age-adjusted mortality rates have decreased in virtually every category of sex, race/ethnicity, and age group.[4] This, even though age-adjusted mortality for all races and both sexes increased between 1975 and 1991. In the following three decades, mortality decreased to a rate of around 150 deaths per 100,000 in 2018. In other words, for all sites combined, cancer is killing at a lower rate now than it was in 1975, and those lower mortality rates are due to decreases that occurred after 1991.
Meanwhile, incidence rates have moved in the opposite direction.[4] For all cancer sites combined, age-adjusted incidence rates have increased for virtually every demographic category named above, and age-adjusted incidence for all races and both sexes for all sites combined has increased from around 400 new cases per 100,000 in 1975 to around 450 per 100,000 in 2018. And similar to mortality, incidence rates also peaked in the early 90s.
So what do we get when we combine these trends? Cancer is killing at a lower rate, but new cases are on the rise. The increasing prevalence of the disease,[5] described by the percent of the population living with cancer, backs this up. (In the thirty years between 1971 and 2001, the percentage of the US population living with cancer more than doubled, from 1.5 to 3.5 percent.)[6]
Why should mortality have decreased, but not incidence?
On the face of it, these opposite trends might seem like a contradiction. But there are several good explanations for why they aren’t. Remember, the health care system is, in general, very reactive. Treatments are designed to react once a disease has already developed (potentially affecting mortality), but not to enhance prevention (which would affect incidence). Furthermore, the increased emphasis on early detection in recent decades may to some extent affect both phenomena; early detection allows doctors to detect disease at a higher rate and also begin treatment earlier, potentially (but not always) improving outcomes.

Tobacco—A Smoking Gun?
Trends in tobacco use are also useful, especially when we’re trying to make out why all-site mortality and incidence rates both peaked in the early 90s. As described by research funded by the American Cancer Society, “most of the reduction in lung cancer death rates observed since 1990 in men and since 2002 in women represents smoking cessation that began among educated men and women in the 1950s.”[7]
The number of lives saved by changes in tobacco use is huge. The deadliest cancer sites as of 2019[4] in terms of overall deaths (rounded to the nearest thousand) are:
- Lung and Bronchus 143,000
- Colorectal 51,000
- Pancreas 46,000
- Breast 42,000
- Liver & intrahepatic bile duct 32,000
- Prostate 32,000
- Leukemia 23,000
- Lymphoma 21,000
Lung/bronchus cancer contributed to nearly 25 percent of all cancer deaths in 2019, a huge proportion of overall cancer mortality. That means decreases in tobacco use are likely to contribute a huge proportion to the decreases in overall cancer mortality.
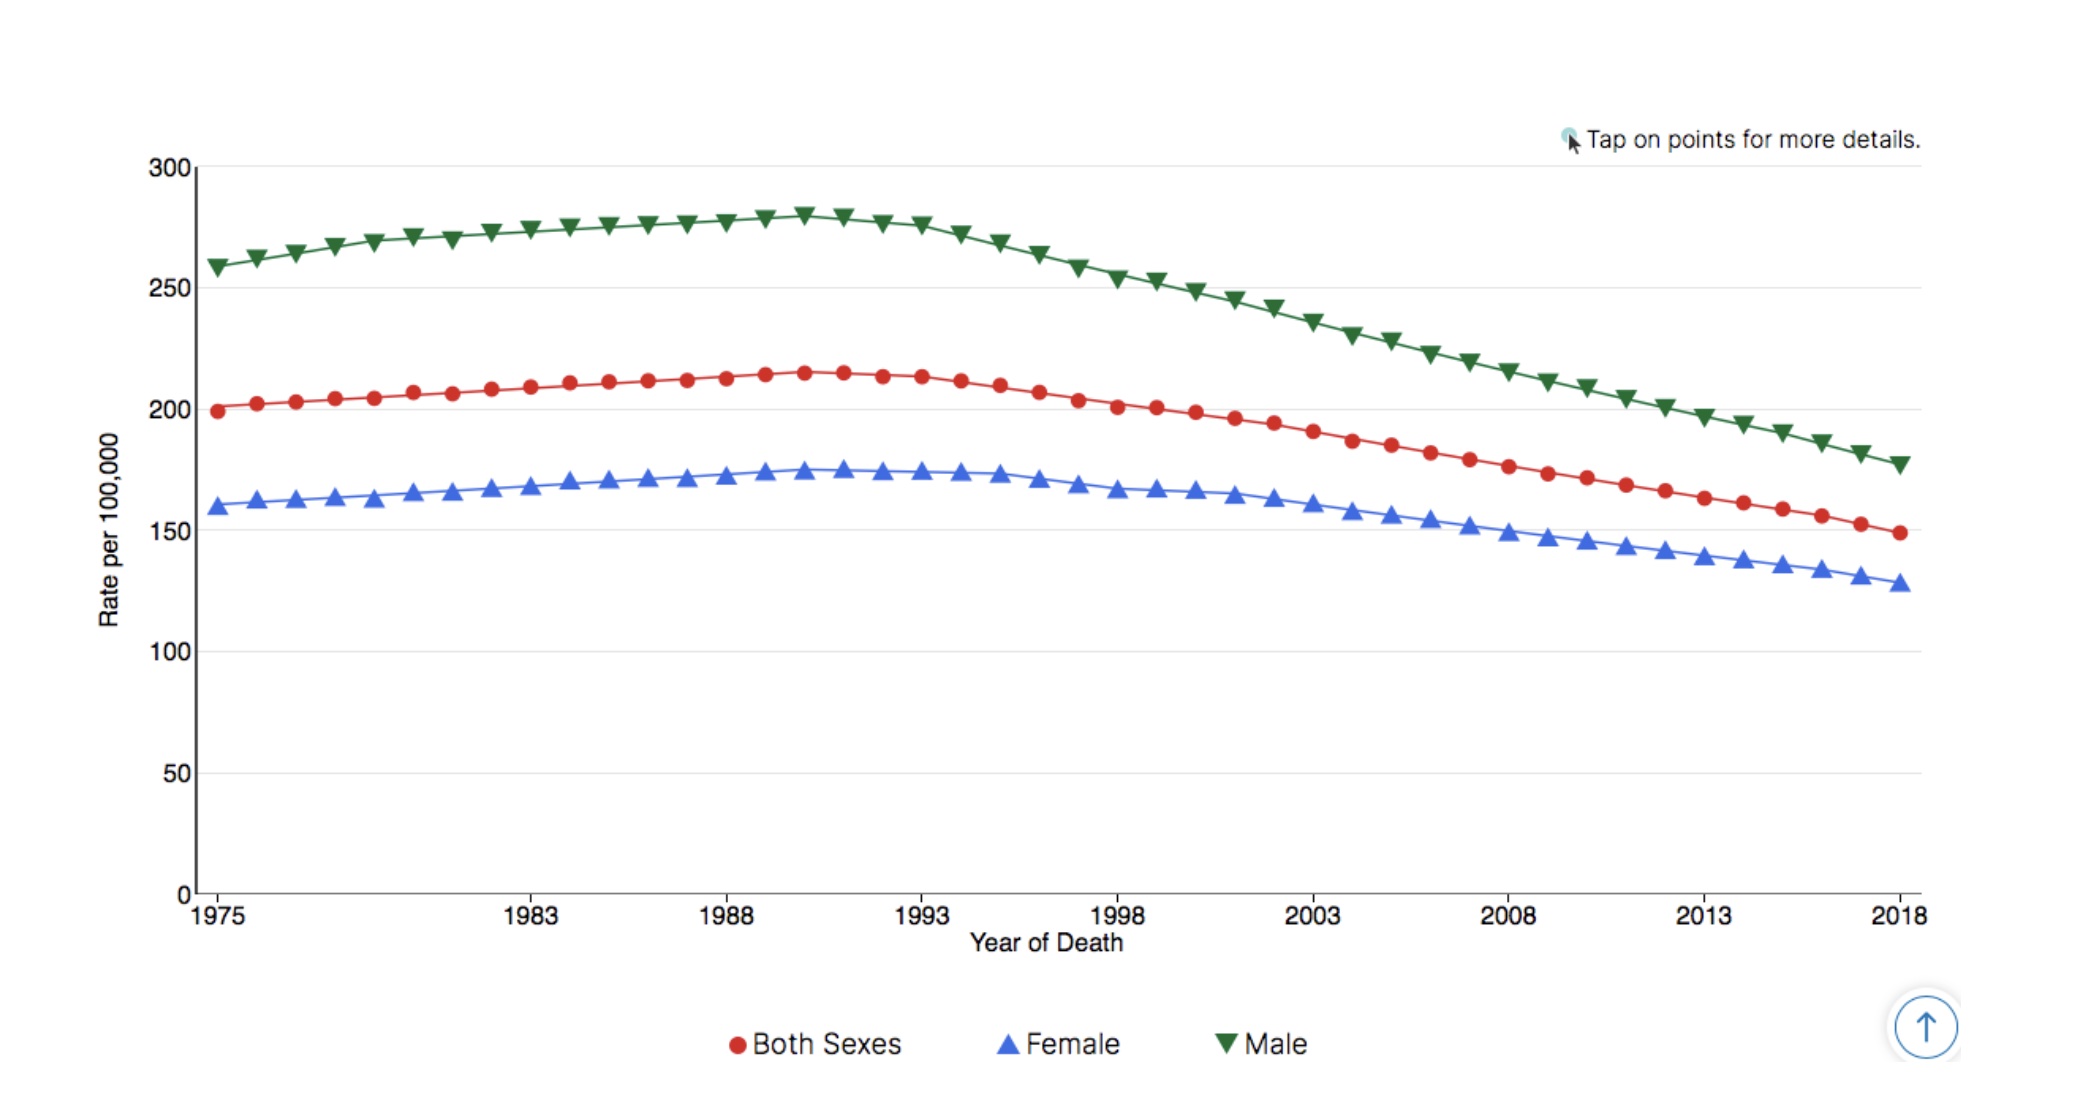
Going back as far as 1930 and comparing site-specific death rates by sex underlines this connection even more.[8] After overtaking liver, stomach, prostate, and colorectal cancers in the years between 1937 and 1956, mortality rates for lung and bronchus cancer continued to soar in males until the late 1980s. Since then, lung/bronchus mortality rates have plummeted more than 50 percent, from nearly 91 per 100,000 to less than 42 per 100,000.[4] Meanwhile, for females, who did not smoke as much (or as early),[9] mortality rates for lung and bronchus cancer did not overtake other leading cancers until later, and did not begin their decline until the early 2000s.[8] Not coincidentally, overall mortality is also significantly lower among women than men.[4]
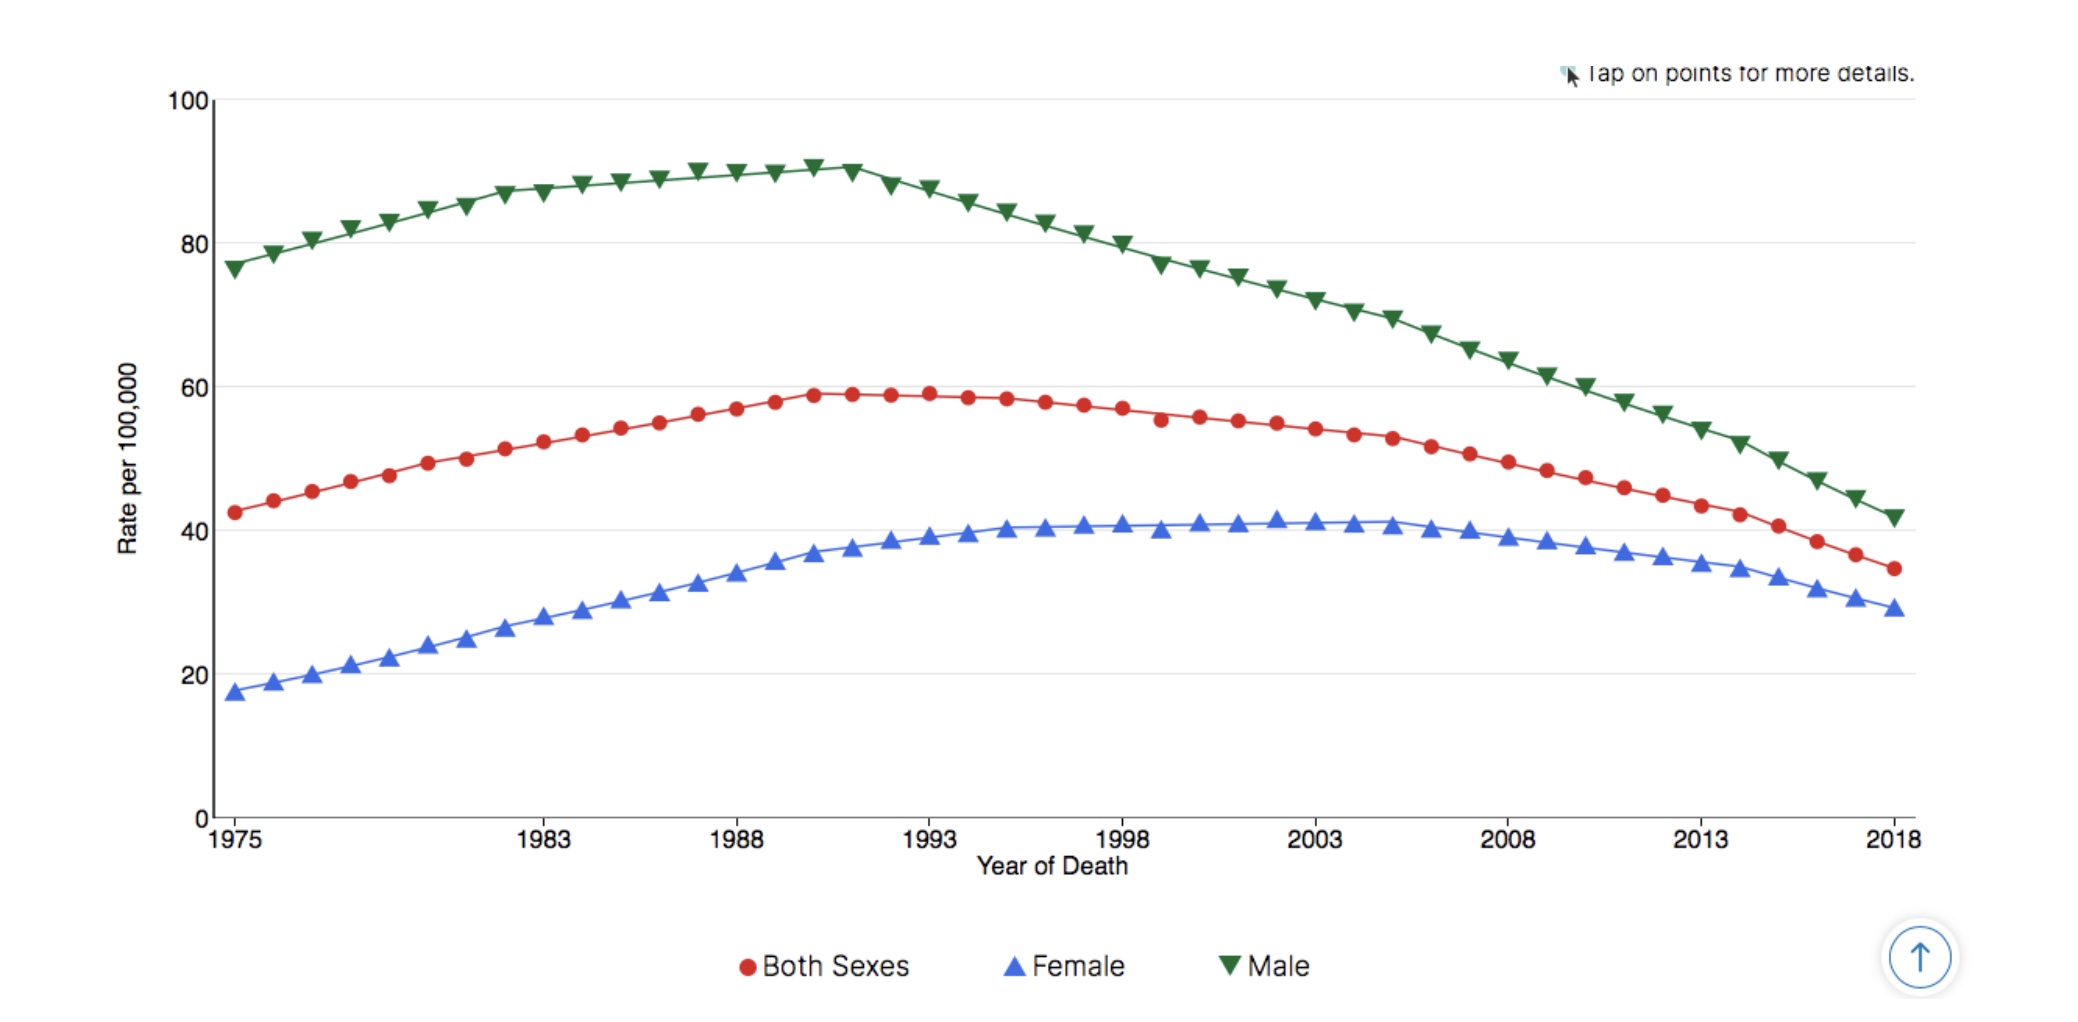
Lung & Bronchus Cancer Long-Term Trends in US Age-Adjusted Mortality Rates, 1975–2018
Source: SEER*Explorer. US Mortality Files, National Center for Health Statistics, CDC[4]
Site-Specific Survival, Incidence, and Mortality Rates
Cancer sites with particularly low 5-year survival rates—that is, the percent of patients that live to five years after diagnosis—include brain (35%), stomach (32%), esophagus (21%), lung and bronchus (20%), liver (19%), and pancreas (9%).[8] Add to these the cancer sites with higher survival rates that still kill a large number of total people (as listed above)—colorectal, breast, prostate, leukemia, and lymphoma—and you have what might be described as a working list of the eleven most threatening cancer sites.
There are some notable exceptions from this list of eleven, especially uterine, ovary, and urinary bladder cancers, but even without those, the 11 cancer sites listed above contributed to more than 72% of estimated cancer deaths in men in 2019, and more than 67% of estimated cancer deaths in women in 2019.[8]
Looking at those specific sites, how have incidence and mortality rates (per 100,000) changed long-term?[4]
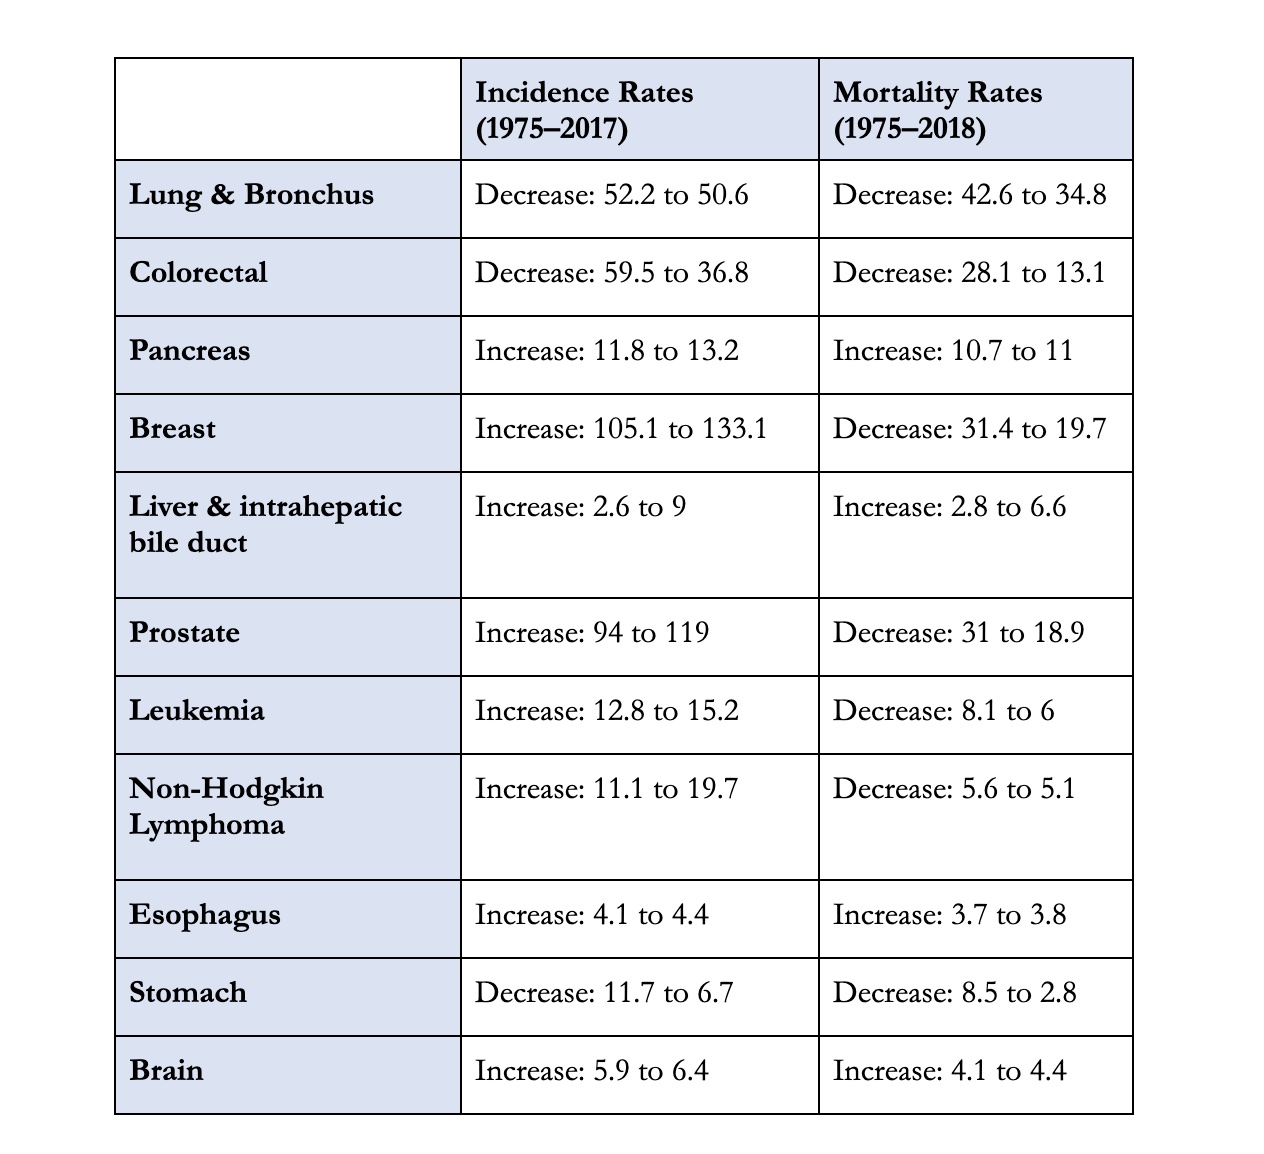
In keeping with the all-sites-combined trends described earlier, there has been a decrease in mortality in most of these cancer sites (seven out of eleven) and an increase in incidence (eight out of eleven). Perhaps the most notable exceptions to these overall trends are colorectal and stomach cancers, for which there have been significant decreases in both mortality and incidence, and cancer of the liver and intrahepatic bile duct, for which there have been significant increases in both mortality and incidence.
5-year relative survival rates have increased for most cancer sites, as well as for all sites combined, since 1975.[8] But these improvements should be regarded with a degree of caution. According to an article published in The Journal of the American Medical Association (JAMA), while increased survival rates are, “generally inferred to mean that cancer treatment has improved… [it] may also reflect changes in diagnosis: finding more people with early-stage cancer, including some who would never become symptomatic.”[10] Researchers conclude that, “changes in 5-year survival over time bear little relationship to changes in cancer mortality.” Indeed, survival rates can improve, “even when incidence is increasing and mortality is unchanged,” such as with melanoma, kidney, and thyroid cancer.[11]
For a stark example of this contradiction, compare the incidence and mortality rates of liver and intrahepatic bile duct cancer with the same disease’s recent survival rates:
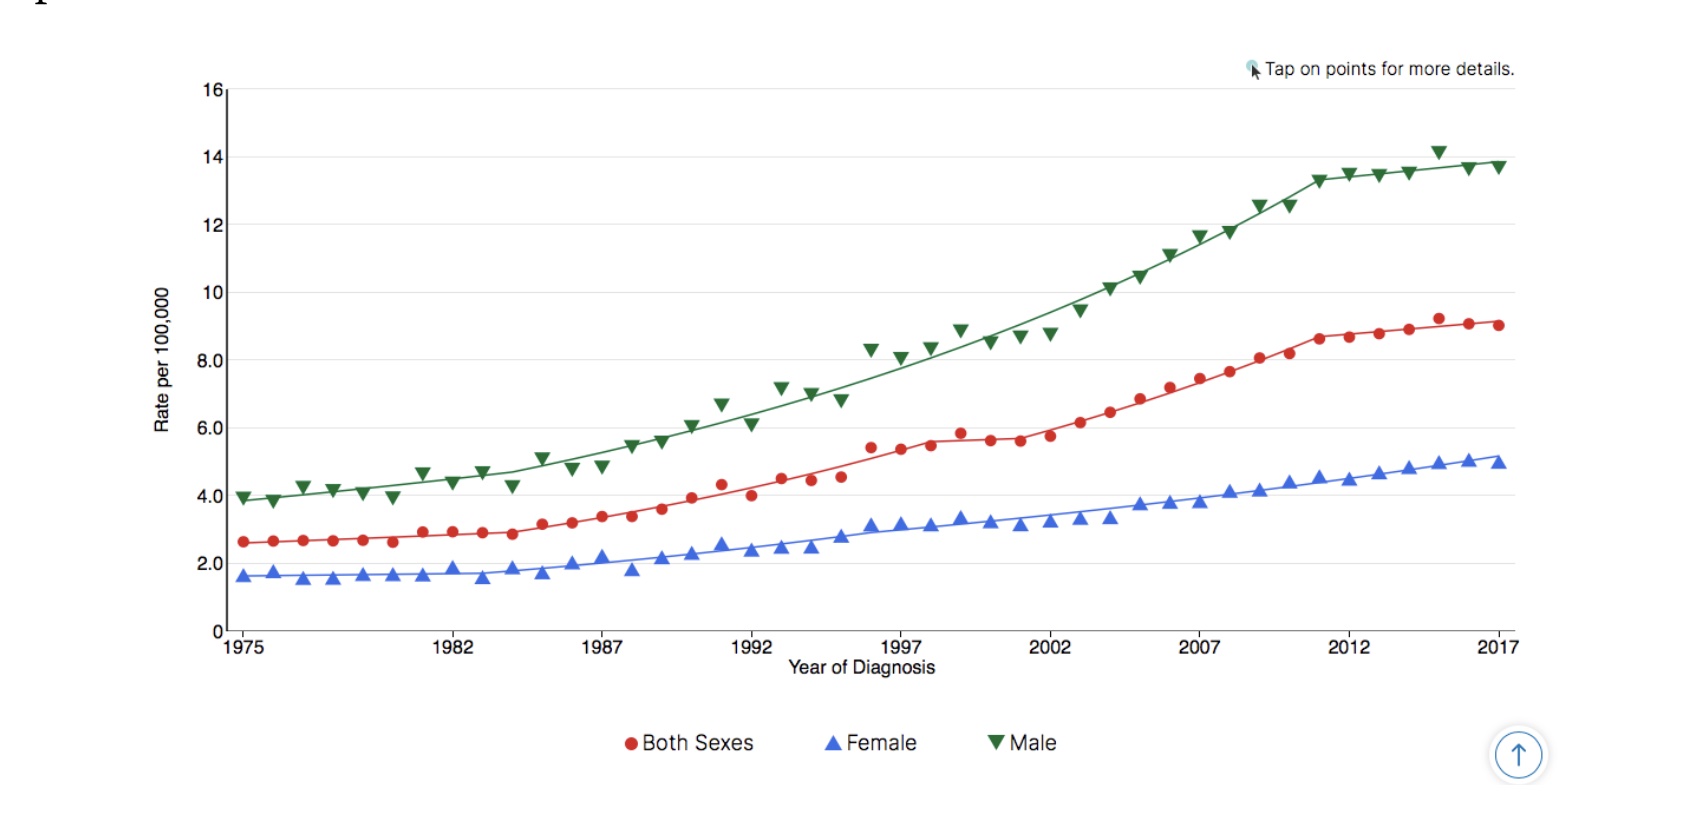
Liver & Intrahepatic Bile Duct Cancer Long-Term Trends in SEER Age-Adjusted Incidence Rates, 1975–2017
Source: SEER*Explorer. SEER 9 areas[4]
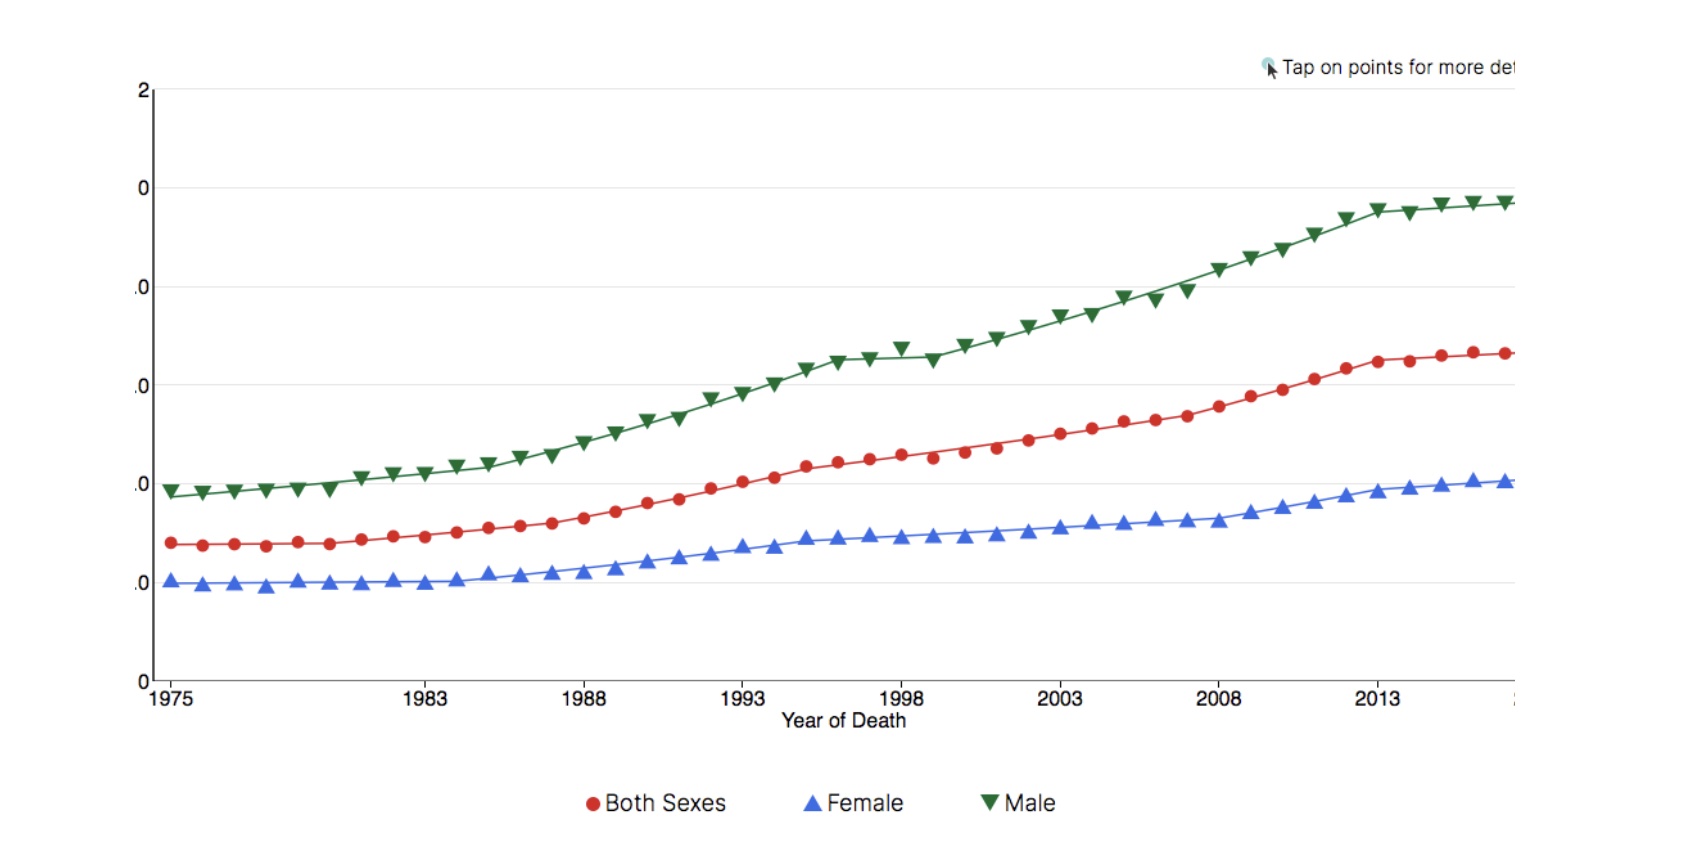
Liver & Intrahepatic Bile Duct Cancer Long-Term Trends in US Age-Adjusted Mortality Rates, 1975–2018
Source: SEER*Explorer. US Mortality Files, National Center for Health Statistics, CDC[4]
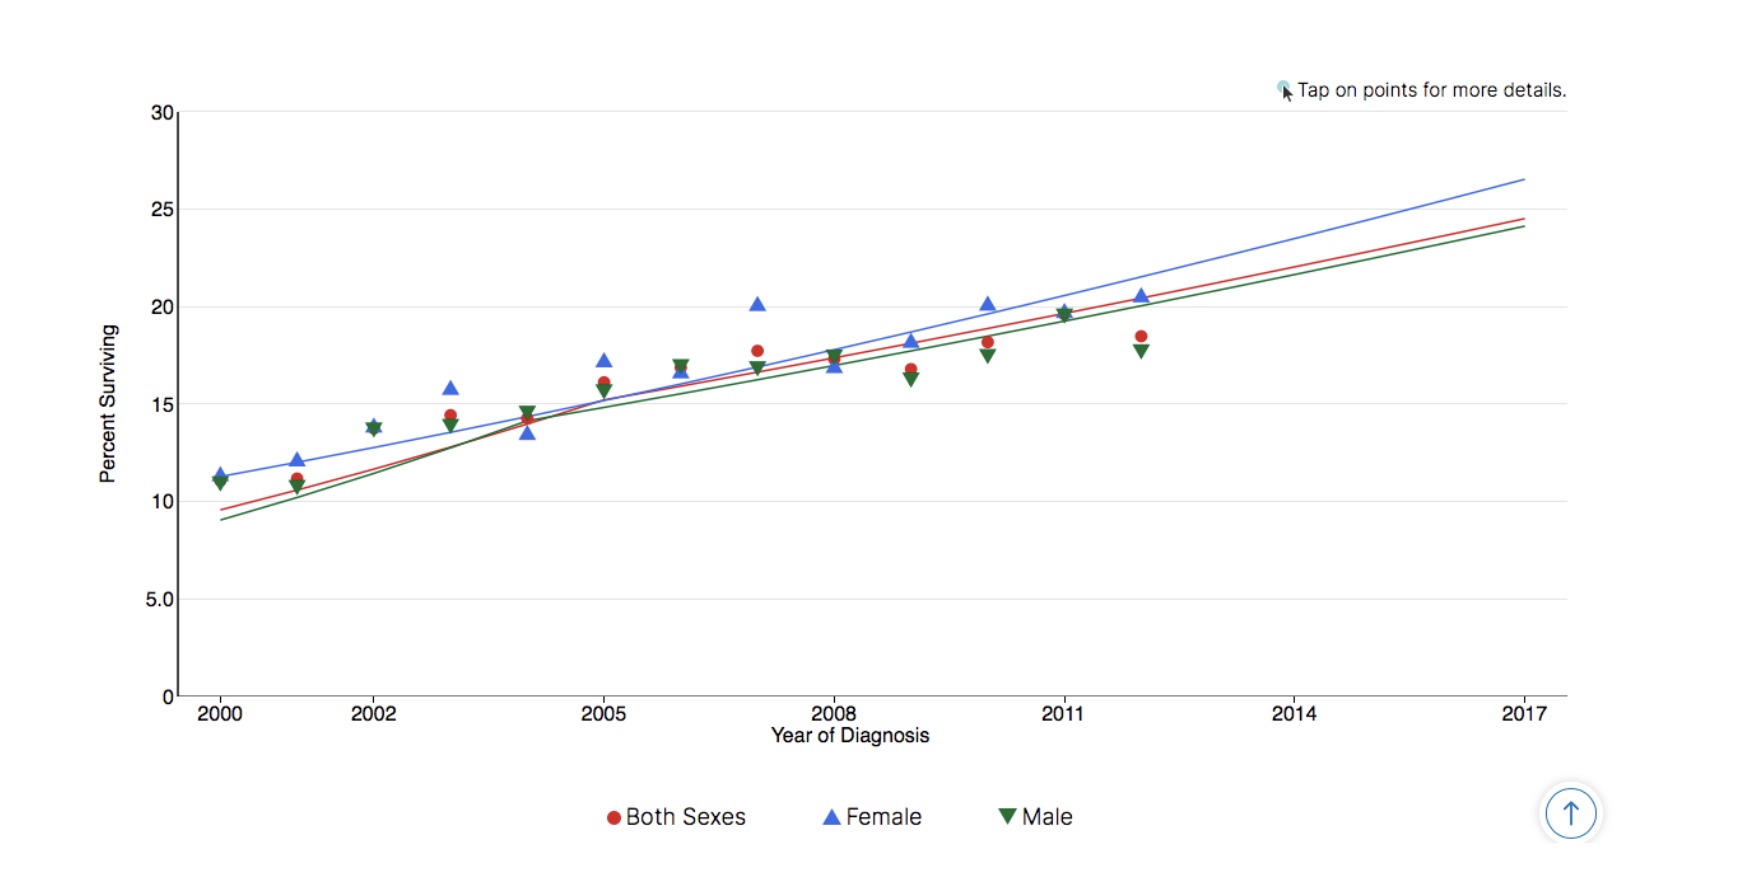
Liver & Intrahepatic Bile Duct Cancer Recent Trends in SEER Relative Survival Rates, 2000–2016
Source: SEER*Explorer. Seer 18 areas[4]

What Conclusions Can We Draw From This Data?
Let’s be clear—though this may feel like an overwhelming amount of data, we have only scratched the surface. It would be easy to cherry-pick data on certain types of cancer, in certain date ranges, to argue that the “war on cancer” has been a great success or failure. If anything, the data presented here illustrate how difficult it is to answer the question posed at the beginning of this article—are we winning the war? I warned you that the question is fraught; after surveying nearly five decades of trends, the question largely remains so. Nevertheless, there are several key takeaways:
- Cancer incidence (number of cases) is generally on the rise, while cancer mortality (number of deaths) is generally in decline. This indicates that the health care system has made some progress in responding to the disease, but not in preventing the disease. It also means that the disease has become more prevalent in our society. Consequently, the financial burden has also increased. The rising cost of cancer in the US, “[was] expected to reach almost $174 billion by 2020.”[12]
- Factors influencing these trends include changes to how and when doctors diagnose the disease; evolving treatment protocols; and decreased tobacco usage. It’s difficult to quantify exactly how much each of these factors contributes to the overall trends, but their predicted effects are proven out in numerous instances, such as with the huge decreases in lung/bronchus mortality that occurred in men in the early 90s and women in the early 00s, coinciding with a decline in smoking.[7]
- Site-specific cancer trends reflect the more general trends but require greater context. Worsening outcomes for liver and pancreatic cancer patients—two of the deadliest cancers—suggest a long road ahead; improvements for colorectal cancer patients, on the other hand, may be of some comfort. Even in the latter, however, it’s easy to cherry-pick whichever interpretation one prefers. Whether we have achieved great progress against colorectal cancer depends on who “we” are—how old we are, where in the world we live, and how our national diets are changing. Alarmingly, “incidence and mortality rates [for colorectal cancer] vary up to 10-fold worldwide… [and] are still rising rapidly in many low-income and middle-income countries” [emphasis added].[13]
- Again, because it cannot be emphasized enough, context matters. We only need to look at changing survival rates for an example of how data can sometimes be misleading. Likewise, decreasing mortality rates should be considered alongside quality of life measurements. As with life expectancy more generally, it’s important to know not only how likely we are going to be able to live with a disease, but also how well we may live with the disease.
What do you think? How well are we as a society living with this dreaded disease? What questions do you still have about cancer in the US, and worldwide? What do you see as the biggest gaps in knowledge, both public and professional, and where would you like to see more resources allocated?
This article is part of a series on The Future of Nutrition: An Insider’s Look at the Science, Why We Keep Getting It Wrong, and How to Start Getting It Right by T. Colin Campbell, Ph.D., (with Nelson Disla).
References
- National Cancer Institute. National Cancer Act of 1971 (2016). https://www.cancer.gov/about-nci/legislative/history/national-cancer-act-1971#declarations.
- Centers for Disease Control and Prevention (CDC) National Center for Health Statistics (NCHS). Leading Causes of Death (2017). https://www.cdc.gov/nchs/fastats/leading-causes-of-death.htm.
- Hanahan, D. Rethinking the war on cancer. Lancet 383, 558-563 (2014). https://doi.org/10.1016/S0140-6736(13)62226-6
- National Cancer Institute (NCI) Surveillance, Epidemiology, and End Results Program (SEER). SEER*Explorer (2020). https://seer.cancer.gov/explorer/application.html?site=1&data_type=1&graph_type=2&compareBy=sex&chk_sex_3=3&chk_sex_2=2&race=1&age_range=1&hdn_stage=101&rate_type=2&advopt_precision=1&advopt_display=2
- Crimmins, E. M. & Beltran-Sanchez, H. Mortality and morbidity trends: is there compression of morbidity? J Gerontol B Psychol Sci Soc Sci 66, 75–86 (2011) doi:10.1093/geronb/gbq088
- Rowland, J., Mariotto, A., Aziz, N., et al. Cancer survivorship—United States, 1971–2001. Centers for Disease Control and Prevention Morbidity and Mortality Weekly Report (MMWR) 53(24), 526–529 (2004). https://www.cdc.gov/mmwr/preview/mmwrhtml/mm5324a3.htm
- Jemal, A., Ward, E., & Thun, M. Declining death rates reflect progress against cancer. PloS one 5(3), e9584 (2010). https://doi.org/10.1371/journal.pone.0009584
- American Cancer Society. Cancer facts & figures 2019. https://www.cancer.org/content/dam/cancer-org/research/cancer-facts-and-statistics/annual-cancer-facts-and-figures/2019/cancer-facts-and-figures-2019.pdf
- American Lung Association. Women and tobacco use (2020). https://www.lung.org/quit-smoking/smoking-facts/impact-of-tobacco-use/women-and-tobacco-use
- Welch, H. G., Schwartz, L. M., Woloshin, S. Are increasing 5-year survival rates evidence of success against cancer? Journal of the American Medical Association (JAMA) 283(22), 2975–8 (2000). doi: 10.1001/jama.283.22.2975.
- Cho, H., Mariotto A. B., Schwartz, L. M., Luo, J., Woloshin, S. When do changes in cancer survival mean progress? The insight from population incidence and mortality. J Natl Cancer Inst Monogr 49, 187–97 (2014). doi: 10.1093/jncimonographs/lgu014.
- Centers for Disease Control and Prevention (CDC) National Center for Chronic Disease Prevention and Health Promotion (NCCDPHP). Health and economic costs of chronic diseases (2020). https://www.cdc.gov/chronicdisease/about/costs/index.htm
- Arnold M., Sierra M. S., Laversanne M., et al. Global patterns and trends in colorectal cancer incidence and mortality. Gut 66, 683–691 (2017). https://gut.bmj.com/content/66/4/683
You Might Also Like


Copyright 2025 Center for Nutrition Studies. All rights reserved.

Deepen Your Knowledge With Our
Plant-Based Nutrition
Certificate
Plant-Based Nutrition Certificate
- 23,000+ students
- 100% online, learn at your own pace
- No prerequisites
- Continuing education credits